Designing (and drawing) Data with a ‘Post-Infographic’ Mindset - Talk & Workshop
Event Details
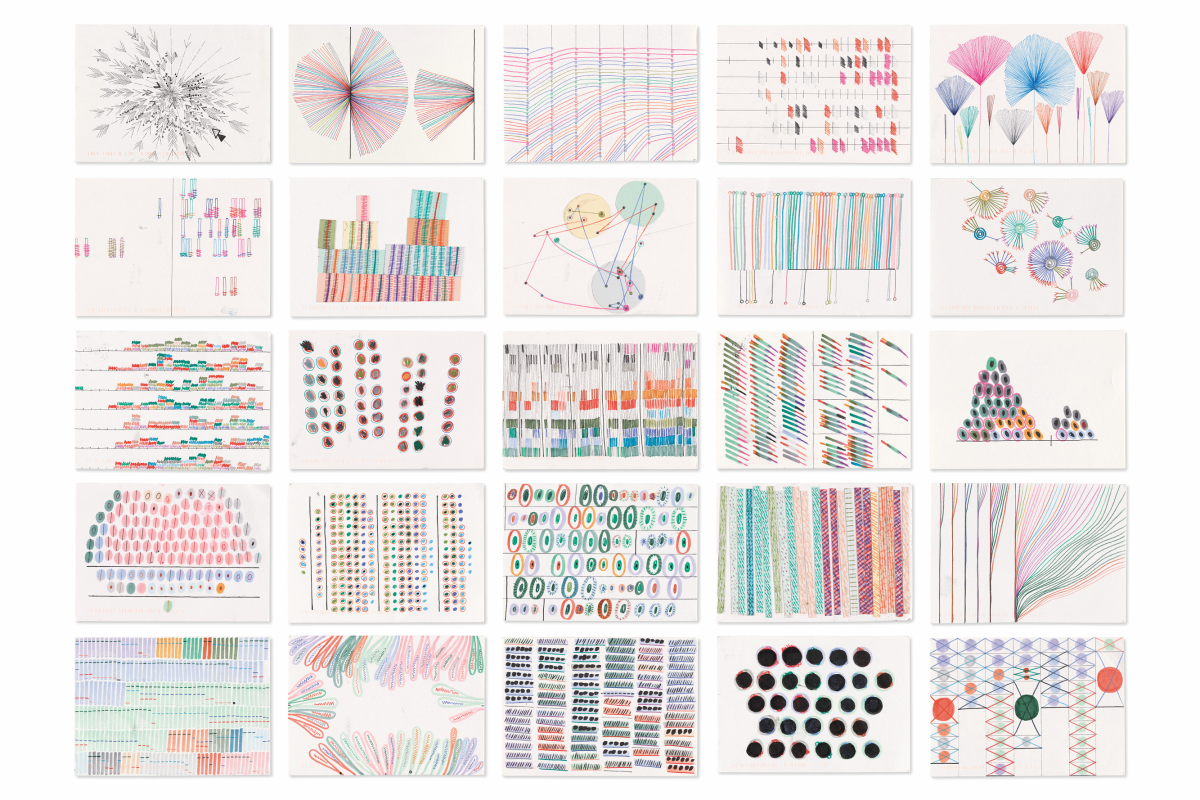
Infographics are ubiquitous in our media, and you’d be forgiven for assuming that they were the only visual, creative output possible when working with a dataset. However, in today’s ‘post-infographic’ world, data can be used in so many different ways, from personal documentation or memoir, an input for art, or a way of connecting a community! Stefanie will use examples from her practice to explore what a ‘post-infographic’ design approach might look like while also sharing tips on how to communicate data with a spirit of openness and experimentation.
After her talk, Stefanie will walk you through a fast-paced workshop, where you will learn dataviz basics through visualising your personal data points!
Materials needed: Bring A4 paper and your favourite basic drawing materials (coloured pencils, markers, and pens)
About
Stefanie Posavec is a designer, artist, and author focused on creating playful, accessible, human-scaled approaches to communicating data.
Her data-driven work has been exhibited internationally at major galleries including the V&A, the Design Museum, Somerset House, and the Wellcome Collection (London), the Centre Pompidou (Paris), and MoMA (New York). She was Facebook's first data-artist-in-residence at their Menlo Park campus, and recent art residencies include the National Maritime Museum in Greenwich, London. Her work is also in the permanent collection of MoMA, New York, and was nominated for the London Design Museum’s ‘Designs of the Year’ competition in 2016.
Her latest illustrated book (I am a book. I am a portal to the universe., co-authored with Miriam Quick) was named one of the Financial Times’s ‘Best Books of the Year 2020’ and shortlisted for the Royal Society’s Young People’s Book Prize 2021. She has also co-authored two books that emphasise a handmade, personal approach to data: Dear Data and the journal Observe, Collect, Draw!